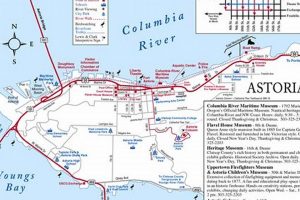
Visual representations depicting potential inundation zones along the Oregon coast resulting from tsunami events are crucial tools for preparedness. These cartographic products delineate areas at risk of flooding based on modeled scenarios involving varying magnitudes of seismic activity and subsequent wave propagation. They incorporate factors such as coastal elevation, bathymetry, and historical tsunami data to estimate inundation extent. For example, a specific location’s inclusion within the colored zone of a map signifies a potential risk of inundation during a designated event.
The significance of accurately portraying potential tsunami impacts lies in the enhancement of public safety and effective emergency response planning. These visualizations facilitate community understanding of risk levels, informing decisions regarding evacuation routes, building codes, and land-use management. Historically, Oregon has experienced several tsunami events, highlighting the ongoing need for updated and readily accessible information to mitigate potential damage and loss of life. They offer a framework for resource allocation and infrastructure resilience efforts in coastal communities.
The following sections will delve into the creation, interpretation, and practical applications of these visualizations, examining their role in shaping community resilience and promoting informed decision-making in the face of a potential tsunami threat. Furthermore, it will address the ongoing research and technological advancements refining these predictive tools.
Understanding Tsunami Preparedness using Oregon Coastal Inundation Visualizations
The following tips provide guidance on utilizing Oregon coastal inundation visualizations for enhanced safety and preparedness in the event of a tsunami.
Tip 1: Consult Official Sources: Obtain inundation visualizations exclusively from recognized governmental agencies, such as the Oregon Department of Geology and Mineral Industries (DOGAMI) or the National Oceanic and Atmospheric Administration (NOAA). These sources provide the most accurate and up-to-date information.
Tip 2: Identify Your Location’s Risk: Determine if a residence, workplace, or frequent visitation area is located within a designated inundation zone. The visuals delineate areas potentially affected by varying tsunami scenarios, typically categorized by magnitude.
Tip 3: Understand Evacuation Routes: Familiarize oneself with designated tsunami evacuation routes for any area identified within an inundation zone. Evacuation routes are often marked with signage and are designed to lead to higher ground outside the potential inundation area.
Tip 4: Heed Official Warnings: During a tsunami warning, immediately evacuate to higher ground, following established evacuation routes. Do not wait to observe the tsunami’s arrival; immediate action is critical.
Tip 5: Participate in Community Preparedness Efforts: Engage with local emergency management agencies and community organizations to learn about tsunami preparedness initiatives, drills, and resources available in one’s community. Active participation strengthens overall community resilience.
Tip 6: Understand Limitations: Recognize that inundation visualizations are based on models and projections, and actual inundation extents may vary. These visuals are intended as planning tools and should not be considered definitive predictions.
Tip 7: Stay Informed About Updates: Inundation visualizations are subject to updates based on new scientific data, modeling techniques, and seismic activity. Regularly check for the latest versions to ensure access to the most current information.
Utilizing these tips promotes a proactive approach to tsunami preparedness, enhancing individual and community safety along the Oregon coast. Understanding and acting upon the information conveyed through inundation visualizations is paramount to mitigating potential risks.
The subsequent sections will elaborate on specific aspects of these tips, providing further detail and context for effective implementation.
1. Inundation Zones
Inundation zones, as depicted on an Oregon tsunami map, represent areas along the coastline predicted to experience flooding as a result of a tsunami event. The delineation of these zones is based on scientific modeling that incorporates factors such as the potential magnitude of an earthquake, the bathymetry of the ocean floor, and the topography of the coastal land. These zones visually convey the potential extent of a tsunami’s reach, acting as a critical component for risk assessment and emergency planning.
The relationship between inundation zones and the Oregon tsunami map is one of cause and effect: seismic events cause tsunamis, and the maps delineate the predicted resulting inundation. For example, maps may show differing zones based on Cascadia Subduction Zone scenarios versus local fault scenarios. The identification of specific areas as inundation zones necessitates the implementation of targeted evacuation plans and infrastructure upgrades. Communities use these maps to determine safe assembly areas and escape routes. Without these zones, communities lack the information to protect themselves in case of a natural disaster.
The accuracy and accessibility of inundation zone information are paramount for effective preparedness. Continuous monitoring of seismic activity and refinement of modeling techniques are essential to improve the accuracy of these maps. Further, effective communication strategies are required to ensure the public understands the meaning of the zones and can respond appropriately during a tsunami warning. Therefore, inundation zones form an indispensable component of risk management strategies along the Oregon coast.
2. Evacuation Routes
Evacuation routes along the Oregon coast are intrinsically linked to inundation visuals, serving as a critical response mechanism based on the potential flooding areas delineated within those tools. The existence of mapped inundation zones necessitates the establishment and maintenance of clearly defined evacuation routes to guide individuals to safety during a tsunami event. These routes are designed to lead from areas at risk of flooding to higher ground, away from the predicted tsunami inundation area. The planning and marking of these routes represent a direct consequence of the information displayed on visualizations depicting potential inundation zones.
The effectiveness of evacuation routes as a component of the tool depends on several factors, including the accuracy of the underlying inundation modeling, the clarity of route signage, and public awareness. For example, coastal communities regularly conduct tsunami evacuation drills to familiarize residents with designated routes and safe assembly points. This process involves interpreting the map and translating that knowledge into practical action. Furthermore, designated evacuation routes must be regularly reviewed and updated to reflect changes in coastal development, topography, or advances in tsunami modeling. Challenges in this regard may include complex urban environments where evacuation routes are constrained or remote rural areas with limited access to higher ground.
In summary, evacuation routes are an indispensable element of a comprehensive tsunami preparedness strategy for Oregon coastal communities. Their existence and efficacy are directly reliant on accurate inundation visuals, which define the areas requiring evacuation. Continuous improvement of inundation modeling, route planning, and public awareness campaigns is essential to ensure these routes effectively serve their purpose: guiding individuals to safety during a tsunami event. These routes are more than just paths; they are lifelines constructed from visual data, preparedness, and community action.
3. Source Accuracy
Source accuracy is paramount in the context of inundation visuals due to the life-safety implications inherent in their use. These maps form the basis for evacuation plans, building codes, and emergency response strategies along the Oregon coast. Therefore, the reliability of the information presented on such visualizations is non-negotiable. The models used to generate these visuals rely on extensive datasets, including bathymetry, topography, seismic history, and hydrodynamic simulations. Errors or uncertainties in any of these source datasets can propagate through the modeling process, leading to inaccurate inundation predictions. For example, if bathymetric data is outdated or incomplete, the modeled wave propagation and inundation extent may deviate significantly from reality.
The Oregon Department of Geology and Mineral Industries (DOGAMI) and the National Oceanic and Atmospheric Administration (NOAA) are primary sources for officially sanctioned inundation visuals. These organizations employ rigorous quality control procedures to ensure data integrity and model validation. For instance, DOGAMI utilizes LiDAR (Light Detection and Ranging) technology to obtain high-resolution elevation data, which is crucial for accurately mapping inundation zones. The use of multiple independent modeling approaches and comparison with historical tsunami inundation data further enhances the reliability of the resultant maps. Reliance on non-official sources or outdated information can lead to underestimation or overestimation of the tsunami hazard, potentially compromising the effectiveness of preparedness measures.
In conclusion, the accuracy of inundation visuals is not merely a technical detail but a fundamental requirement for effective tsunami risk management. The use of validated data from reputable sources, coupled with continuous refinement of modeling techniques, is essential to maintain the integrity of these maps. Coastal communities and individuals must prioritize official sources when accessing information and understand that these visuals are planning tools subject to inherent uncertainties. By emphasizing source accuracy, Oregon can enhance the resilience of its coastal regions and minimize potential losses from future tsunami events.
4. Modeling Scenarios
Modeling scenarios constitute a foundational element in the creation and interpretation of Oregon tsunami maps. These maps, depicting potential inundation zones, are not based on a single, monolithic prediction but rather on a range of plausible earthquake and tsunami scenarios. Each scenario represents a distinct combination of parameters, such as the magnitude and location of a potential earthquake along the Cascadia Subduction Zone or other local fault systems. The variations in these parameters directly influence the predicted tsunami wave height, arrival time, and extent of inundation, resulting in differing inundation zones displayed on the map. Consequently, a map typically incorporates multiple scenarios, illustrating the range of potential impacts from various tsunami events. The significance of modeling scenarios lies in their capacity to provide a comprehensive understanding of the spectrum of possible risks, facilitating more informed preparedness and mitigation strategies. Without these varied scenarios, the maps would present an incomplete and potentially misleading picture of the actual tsunami hazard.
The practical application of modeling scenarios is evident in the development of tiered evacuation plans. For instance, one scenario might represent a relatively small, locally generated tsunami, requiring evacuation of only the immediate shoreline, while another scenario could simulate a large subduction zone event, necessitating a more extensive evacuation inland. Emergency managers utilize these scenario-based maps to define evacuation zones, plan evacuation routes, and allocate resources based on the specific threat level. Similarly, building codes in coastal communities often incorporate modeling scenarios to determine structural requirements for new construction in inundation zones. For example, critical facilities, such as hospitals and emergency operations centers, may be required to withstand inundation depths predicted by the most severe credible tsunami scenario. The use of diverse scenarios also allows for the assessment of uncertainty in tsunami predictions. By comparing the inundation extents predicted by different models and scenarios, scientists can identify areas where the predictions are most sensitive to variations in input parameters.
In conclusion, modeling scenarios are not merely abstract exercises but integral components of Oregon tsunami maps, directly informing risk assessments, evacuation planning, and infrastructure design. The accuracy and comprehensiveness of these scenarios are paramount for effective tsunami preparedness. Challenges remain in refining modeling techniques, reducing uncertainties, and effectively communicating the complexities of scenario-based risk assessments to the public. However, ongoing research and technological advancements continue to improve the fidelity and utility of these maps, contributing to a more resilient and prepared Oregon coastline. Understanding the underpinnings of these scenario is the ultimate key to the map.
5. Risk Assessment
Risk assessment forms a cornerstone in the effective utilization of the Oregon tsunami map. The map itself is a visual representation of potential hazards; however, its value lies in its capacity to inform a comprehensive evaluation of risk. This assessment process encompasses identifying assets (people, infrastructure, resources) vulnerable to tsunami inundation, evaluating the likelihood of various tsunami events, and determining the potential consequences of such events on those assets. For example, a risk assessment may identify a coastal hospital as a high-priority asset due to its critical role in emergency response and the potential for significant casualties should it be inundated. The map assists in determining the probability and extent of flooding affecting the hospital, directly informing mitigation strategies.
The importance of risk assessment as a component of the Oregon tsunami map stems from its ability to prioritize resources and guide decision-making. Coastal communities can use the map, in conjunction with vulnerability analyses, to determine the most effective locations for evacuation routes and assembly areas. Real-life examples include the development of community-specific evacuation plans based on mapped inundation zones and the implementation of stricter building codes in high-risk areas. Moreover, the map informs the development of emergency response plans by state and local agencies, allowing for efficient deployment of personnel and resources during a tsunami event. Understanding the interconnectedness of risk assessment and inundation visualizations allows for effective preparedness measures.
In conclusion, risk assessment provides the vital link between the Oregon tsunami map and practical preparedness. By integrating the map’s visual information with vulnerability analyses and consequence evaluations, coastal communities can develop targeted mitigation and response strategies. Challenges remain in accurately quantifying the economic and social impacts of tsunami events and in effectively communicating risk information to the public. The continuous refinement of risk assessment methodologies and the ongoing updating of inundation visualizations are essential to enhance coastal resilience and minimize the potential for loss from future tsunami events. It is a continuing process.
6. Community Planning
Community planning along the Oregon coast is fundamentally shaped by the potential threat of tsunamis, making the Oregon tsunami map an indispensable tool. This map serves as the basis for informed decision-making related to land use, infrastructure development, and emergency preparedness, ensuring community resilience in the face of a natural disaster.
- Land Use Regulations
Zoning regulations are directly influenced by the map, dictating permissible uses within identified inundation zones. For example, residential development may be restricted or require specific elevation standards in high-risk areas. Commercial development may be encouraged in designated evacuation assembly areas. These regulations aim to minimize potential damage and facilitate rapid evacuation.
- Infrastructure Resilience
The map informs the design and location of critical infrastructure, such as hospitals, emergency operations centers, and communication networks. These facilities are strategically situated outside inundation zones or engineered to withstand potential tsunami forces. Upgrades to existing infrastructure may also be prioritized based on risk assessments informed by map data, ensuring vital services remain operational during and after an event.
- Emergency Preparedness Drills
The Oregon tsunami map serves as a visual aid during community-wide preparedness drills. These exercises familiarize residents with evacuation routes, assembly areas, and warning systems, enhancing their ability to respond effectively during a real tsunami event. Community planners use the map to simulate various tsunami scenarios and evaluate the effectiveness of existing evacuation plans.
- Public Education Campaigns
Community education campaigns utilize the map to raise awareness of tsunami hazards and promote preparedness among residents and visitors. The map is used to illustrate potential inundation zones, evacuation routes, and safe assembly areas. Educational materials, such as brochures and websites, disseminate information derived from the map, empowering individuals to make informed decisions and take appropriate actions in the event of a tsunami warning.
In essence, the Oregon tsunami map is more than a static image; it is a dynamic planning instrument that guides community development, reinforces infrastructure resilience, and promotes individual and collective preparedness. By integrating map data into all facets of community planning, Oregon coastal communities can significantly reduce their vulnerability to tsunami hazards and enhance their overall safety and well-being.
7. Regular Updates
The sustained relevance and reliability of any Oregon tsunami map hinge directly on the implementation of regular updates. Tsunami hazard assessments are not static; they necessitate continuous refinement to incorporate new data, improved modeling techniques, and changes in coastal topography or development patterns. Failure to provide regular updates renders the map increasingly obsolete and potentially misleading, undermining its purpose as a critical tool for risk mitigation and emergency preparedness.
- Incorporation of New Seismic Data
Ongoing seismic monitoring and research provide updated insights into the fault behavior of the Cascadia Subduction Zone and other regional seismic sources. New earthquake data, including magnitude, location, and rupture characteristics, directly impacts tsunami modeling and the resulting inundation projections. Regular updates to the map ensure it reflects the most current understanding of potential earthquake sources and their associated tsunami hazards.
- Advancements in Modeling Technology
Tsunami modeling is a continuously evolving field. New numerical models and computational techniques improve the accuracy and resolution of inundation simulations. These advancements allow for more realistic representations of wave propagation, run-up, and inundation extent, particularly in complex coastal environments. Regular map updates incorporate these improved modeling capabilities, resulting in more precise and reliable inundation zone delineations.
- Changes in Coastal Topography and Development
Coastal erosion, sedimentation, and human development activities (e.g., construction of seawalls, dredging of harbors) can alter coastal topography, affecting tsunami inundation patterns. Regular updates to the map incorporate updated topographic data to account for these changes, ensuring the inundation zones accurately reflect the current coastal landscape. Similarly, new construction within or near inundation zones necessitates revisions to evacuation plans and risk assessments, which are reflected in updated maps.
- Integration of Post-Event Data
Following any significant tsunami event worldwide, valuable data is collected regarding actual inundation extents, wave heights, and damage patterns. This post-event data serves to validate and refine tsunami models, improving their predictive capabilities. Regular map updates incorporate lessons learned from past events, both locally and globally, leading to more robust and reliable inundation projections.
The commitment to regular updates transcends the technical aspects of data acquisition and modeling; it reflects a broader commitment to public safety and informed decision-making. By ensuring the Oregon tsunami map remains current and accurate, authorities empower coastal communities to effectively mitigate risk, prepare for potential events, and protect lives and property. The map’s value is proportional to the dedication to its ongoing maintenance and refinement.
Frequently Asked Questions
The following questions address common inquiries regarding the Oregon tsunami map and its implications for coastal safety.
Question 1: What is the Oregon Tsunami Map?
The Oregon Tsunami Map is a cartographic depiction of potential inundation zones along the Oregon coast resulting from various modeled tsunami scenarios. It provides visual information regarding areas at risk of flooding based on earthquake magnitude and location.
Question 2: Where can the Oregon Tsunami Map be accessed?
The official Oregon Tsunami Map is accessible through the Oregon Department of Geology and Mineral Industries (DOGAMI) website and other authorized governmental sources. Reliance on unofficial sources is discouraged.
Question 3: How is the Oregon Tsunami Map created?
The Oregon Tsunami Map is generated through scientific modeling incorporating bathymetry, topography, historical tsunami data, and earthquake parameters. The models simulate tsunami wave propagation and inundation extent.
Question 4: What does the Oregon Tsunami Map depict?
The map delineates areas potentially subject to flooding during a tsunami event. It typically includes color-coded zones representing different levels of inundation risk based on various tsunami scenarios.
Question 5: How should the Oregon Tsunami Map be used?
The map should be used to assess potential tsunami risks in specific locations, plan evacuation routes, and inform emergency preparedness strategies. It serves as a tool for making informed decisions regarding coastal safety.
Question 6: How often is the Oregon Tsunami Map updated?
The Oregon Tsunami Map is updated periodically to incorporate new data, advancements in modeling techniques, and changes in coastal topography. It is essential to consult the most recent version.
Understanding the Oregon Tsunami Map and its limitations is paramount for effective tsunami preparedness along the Oregon coast. Awareness and proactive planning are critical for mitigating potential risks.
The subsequent section will provide detailed instructions on how to interpret and utilize the Oregon Tsunami Map for personal and community safety.
Oregon Tsunami Map
This exploration has underscored the critical role the Oregon tsunami map plays in coastal preparedness. From delineating inundation zones and informing evacuation routes to guiding community planning and necessitating regular updates, the map’s influence extends across various aspects of risk mitigation. The accuracy and accessibility of this visual representation are paramount for empowering coastal communities to make informed decisions and take appropriate action in the face of a potential tsunami threat. The map’s utility relies on scientific rigor, community engagement, and continuous refinement.
The enduring presence of the tsunami threat demands ongoing vigilance and proactive measures. It is imperative that individuals, communities, and governmental agencies continue to utilize the Oregon tsunami map, alongside established safety protocols, to safeguard lives and property. Future efforts should focus on further enhancing the map’s accuracy, expanding public awareness, and fostering a culture of preparedness that transcends generations. The ocean’s power necessitates respect and informed readiness.


